Merge Observed Station Data#
# 1. Standardize Observation CSVs
import glob
import pandas as pd
import numpy as np
import os
import warnings
warnings.simplefilter('ignore')

obs_dir = "data/observation/"
obs_files = glob.glob(os.path.join(obs_dir, "*.csv"))

all_obs_list = []

for f in obs_files:
    df = pd.read_csv(f)
    print(f"Loaded {os.path.basename(f)} with shape {df.shape}")

    # Needs to standardize format and units.
    df["SampleDate"] = pd.to_datetime(df["SampleDate"], errors="coerce")
    df = df.dropna(subset=["SampleDate"])

    # Force pure python float
    df["Result_Value"] = [float(x) if pd.notnull(x) else np.nan for x in pd.to_numeric(df["Result_Value"], errors="coerce")]
    df = df.dropna(subset=["Result_Value"])

    # remove negatives/non-detects
    df = df[df["Result_Value"] > 0]

    # Make StationID standard strings
    df["StationID"] = df["StationID"].astype(str).str.strip().str.lstrip('0')

    # Based on parameter name
    for param in ["TN_ugl"]:
        if param in df["Parameter"].values:
            df.loc[df["Parameter"] == param, "Result_Value"] = df.loc[df["Parameter"] == param, "Result_Value"] / 1000.0

    # Standardize parameter names
    df["Parameter"] = df["Parameter"].replace(
        {"TN_ugl": "TN", "TN_mgl": "TN"}
    )

    # Remove outliers (using general reasonable limits for TN in this region)
    # E.g. TN > 50 mg/L
    df = df[~((df["Parameter"] == "TN") & (df["Result_Value"] > 50))]

    # Drop duplicates
    df = df.drop_duplicates(subset=["StationID", "SampleDate", "Parameter"])

    # Append
    all_obs_list.append(df[["StationID", "SampleDate", "Parameter", "Result_Value"]])

obs_df = pd.concat(all_obs_list, ignore_index=True)
print(f"\nFinal standard obs dataset shape: {obs_df.shape}")
obs_df.head()
Loaded station_02296750_data.csv with shape (911, 21)
Loaded station_02297330_data.csv with shape (379, 21)
Loaded station_270318081593100_data.csv with shape (333, 21)
Loaded station_3556_data.csv with shape (582, 21)
Loaded station_PR14_data.csv with shape (677, 21)
Loaded station_PR18_data.csv with shape (1175, 21)

Final standard obs dataset shape: (2741, 4)
| StationID | SampleDate | Parameter | Result_Value | |
|---|---|---|---|---|
| 0 | 2296750 | 1939-10-31 | TP_ugl | 3500.0 |
| 1 | 2296750 | 1960-10-27 | TP_ugl | 10000.0 |
| 2 | 2296750 | 1960-12-02 | TP_ugl | 8900.0 |
| 3 | 2296750 | 1961-01-12 | TP_ugl | 8300.0 |
| 4 | 2296750 | 1961-03-06 | TP_ugl | 8400.0 |
# 2. Load the Arcadia WAM model output
model_file = "data/model/Station 02296750 (ARCADIA)_reach000084_83.csv"
model_df = pd.read_csv(model_file)

# Align dates to same format
model_df["SimDate"] = pd.to_datetime(model_df["SimDate"], format="mixed", errors="coerce")
model_df = model_df.dropna(subset=["SimDate"])
model_df = model_df.set_index("SimDate")

# We want TN columns
model_df = model_df[["Flow", "TN"]].dropna()
print(f"Arcadia WAM loaded, shape: {model_df.shape}")

# Create USGS flow dataset (Flow is in cubic ft/sec, but this is Arcadia model flow, which serves the same purpose)
flow_df = model_df[["Flow"]]
flow_df.head()
Arcadia WAM loaded, shape: (9132, 2)
| Flow | |
|---|---|
| SimDate | |
| 1999-01-01 00:00:00 | 0.00000 |
| 1999-01-01 12:00:00 | 0.00000 |
| 1999-01-02 12:00:00 | 0.01448 |
| 1999-01-03 12:00:00 | 6.37514 |
| 1999-01-04 12:00:00 | 25.51488 |
# 3. Merge All Data & Produce Timeline

# Merge datasets into one long format
obs_long = obs_df.set_index(["SampleDate", "StationID"])

# Station Timeline & Overlaps
stations = obs_df["StationID"].unique()
print(f"Found {len(stations)} unique stations: {stations}")

# Generate catalog of available data ranges per station
catalog = []
for st in stations:
    st_data = obs_df[obs_df["StationID"] == st]
    min_date = st_data["SampleDate"].min()
    max_date = st_data["SampleDate"].max()
    n_obs = len(st_data)
    catalog.append({
        "StationID": st,
        "Start_Date": min_date,
        "End_Date": max_date,
        "Total_Obs": n_obs
    })

catalog_df = pd.DataFrame(catalog)
print("\n--- Station Timeline Catalog ---")
print(catalog_df)

# Pairwise overlap catalog
print("\n--- Overlap Windows ---")
for i in range(len(stations)):
    for j in range(i+1, len(stations)):
        st1, st2 = stations[i], stations[j]
        data1 = obs_df[obs_df["StationID"] == st1]
        data2 = obs_df[obs_df["StationID"] == st2]

        # Merge on SampleDate & Parameter
        overlap = pd.merge(data1, data2, on=["SampleDate", "Parameter"], suffixes=('_st1', '_st2'))

        if len(overlap) > 0:
            min_ov = overlap["SampleDate"].min()
            max_ov = overlap["SampleDate"].max()
            print(f"{st1} & {st2}: {len(overlap)} overlapping records ({min_ov.date()} to {max_ov.date()})")
        else:
            print(f"{st1} & {st2}: 0 overlapping records")
Found 6 unique stations: <StringArray>
['2296750', '2297330', '270318081593100', '3556', 'PR14', 'PR18']
Length: 6, dtype: str

--- Station Timeline Catalog ---
         StationID Start_Date   End_Date  Total_Obs
0          2296750 1939-10-31 2004-09-29        628
1          2297330 1983-03-10 2000-06-27        118
2  270318081593100 1996-08-26 2000-06-27         94
3             3556 1998-10-08 2024-11-05        582
4             PR14 1996-08-26 2022-12-21        406
5             PR18 1996-08-26 2022-12-21        913

--- Overlap Windows ---
2296750 & 2297330: 9 overlapping records (1984-07-10 to 1998-03-24)
2296750 & 270318081593100: 5 overlapping records (1996-11-19 to 1998-03-24)
2296750 & 3556: 2 overlapping records (1999-08-11 to 1999-08-11)
2296750 & PR14: 9 overlapping records (1996-11-19 to 2002-11-26)
2296750 & PR18: 11 overlapping records (1996-11-19 to 2003-02-12)
2297330 & 270318081593100: 94 overlapping records (1996-08-26 to 2000-06-27)
2297330 & 3556: 0 overlapping records
2297330 & PR14: 94 overlapping records (1996-08-26 to 2000-06-27)
2297330 & PR18: 94 overlapping records (1996-08-26 to 2000-06-27)
270318081593100 & 3556: 0 overlapping records
270318081593100 & PR14: 94 overlapping records (1996-08-26 to 2000-06-27)
270318081593100 & PR18: 94 overlapping records (1996-08-26 to 2000-06-27)
3556 & PR14: 3 overlapping records (2011-10-31 to 2021-05-18)
3556 & PR18: 38 overlapping records (2002-09-04 to 2022-12-06)
PR14 & PR18: 400 overlapping records (1996-08-26 to 2022-12-21)
- Normalize and Merge Observations#
# Since exact day matches produced very few pairs, we can use monthly means or wider temporal overlap windows
from sklearn.linear_model import LinearRegression
from sklearn.model_selection import train_test_split
from sklearn.metrics import mean_squared_error
import matplotlib.pyplot as plt
arcadia_id = "2296750"
stations = obs_df["StationID"].unique()
other_stations = [s for s in stations if s != arcadia_id]
arc_data_monthly = obs_df[obs_df["StationID"] == arcadia_id].set_index(["SampleDate", "Parameter"])["Result_Value"].unstack().resample('ME').mean()
station_models = {}
validation_results = []
fig, axes = plt.subplots(len(other_stations), 1, figsize=(8, 4*len(other_stations)))
if len(other_stations) == 1: axes = [axes]
for i, st in enumerate(other_stations):
st_data_monthly = obs_df[obs_df["StationID"] == st].set_index(["SampleDate", "Parameter"])["Result_Value"].unstack().resample('ME').mean()
paired = pd.merge(arc_data_monthly, st_data_monthly, left_index=True, right_index=True, suffixes=('_arc', '_st'))
for j, param in enumerate(["TN"]):
if f"{param}_arc" not in paired.columns or f"{param}_st" not in paired.columns:
continue
param_pair = paired[[f"{param}_arc", f"{param}_st"]].dropna()
if len(param_pair) < 5:
continue
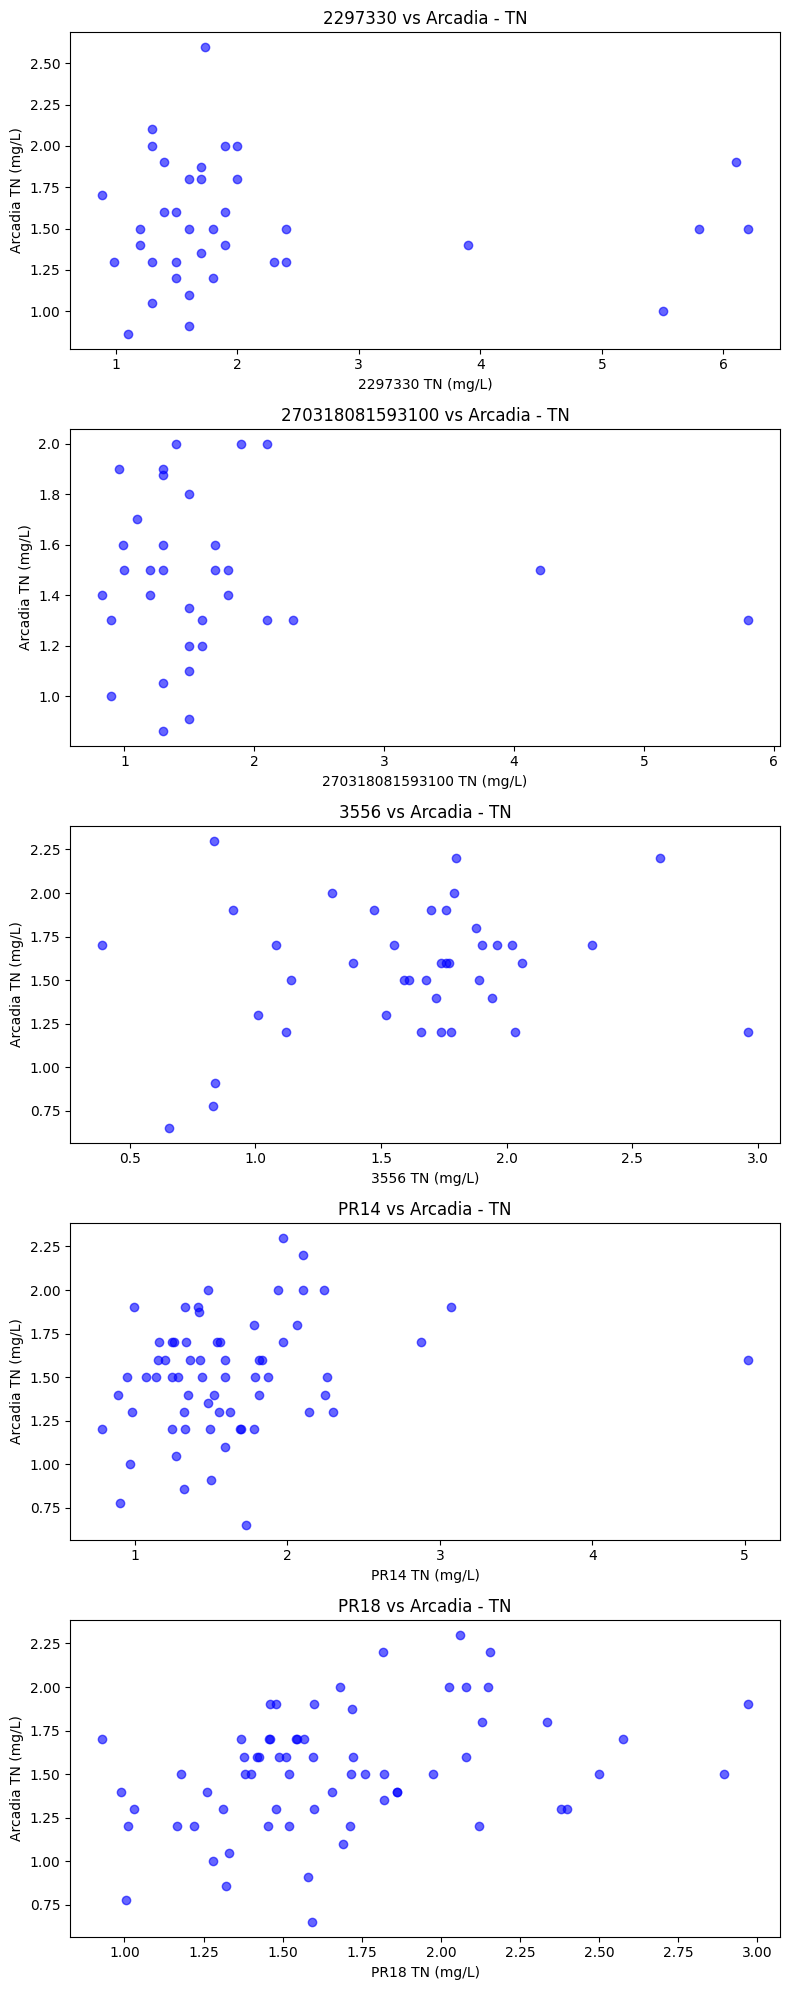
# Exploratory Scatter
ax = axes[i]
sc = ax.scatter(param_pair[f"{param}_st"], param_pair[f"{param}_arc"], alpha=0.6, color='blue')
ax.set_title(f"{st} vs Arcadia - {param}")
ax.set_xlabel(f"{st} {param} (mg/L)")
ax.set_ylabel(f"Arcadia {param} (mg/L)")
# Train-test split
X = param_pair[[f"{param}_st"]]
y = param_pair[f"{param}_arc"]
X_train, X_test, y_train, y_test = train_test_split(X, y, test_size=0.3, random_state=42)
y_st_train = X_train[f"{param}_st"]
y_st_test = X_test[f"{param}_st"]
# 1. Linear Regression
lr = LinearRegression()
lr.fit(y_st_train.values.reshape(-1, 1), y_train)
pred_lr = lr.predict(y_st_test.values.reshape(-1, 1))
rmse_lr = np.sqrt(mean_squared_error(y_test, pred_lr))
# 2. Baseline
rmse_base = np.sqrt(mean_squared_error(y_test, y_st_test))
res = {
"Station": st, "Parameter": param, "N_Overlap": len(param_pair),
"RMSE_Baseline": rmse_base,
"RMSE_LR": rmse_lr
}
validation_results.append(res)
# Force Linear Regression method
station_models[(st, param)] = {"method": "LR", "model": lr, "rmse": rmse_lr}
plt.tight_layout()
plt.show()
val_df = pd.DataFrame(validation_results)
print("\n--- Validation Results (RMSE) - Monthly Relaxed Matches ---")
display(val_df)
--- Validation Results (RMSE) - Monthly Relaxed Matches ---
| Station | Parameter | N_Overlap | RMSE_Baseline | RMSE_LR | |
|---|---|---|---|---|---|
| 0 | 2297330 | TN | 37 | 0.852292 | 0.335531 |
| 1 | 270318081593100 | TN | 33 | 0.510705 | 0.393302 |
| 2 | 3556 | TN | 40 | 0.617846 | 0.409611 |
| 3 | PR14 | TN | 65 | 0.492784 | 0.347609 |
| 4 | PR18 | TN | 66 | 0.549102 | 0.390657 |
# 4. : Transform and Stitch Best Normalized Pipeline
transformed_records = []
# Baseline for Arcadia (self)
arcadia_full = obs_df[obs_df["StationID"] == arcadia_id].copy()
arcadia_full = arcadia_full[arcadia_full["Parameter"] == "TN"].copy() # ENFORCE strictly TN
arcadia_full["Normalized_Value"] = arcadia_full["Result_Value"]
arcadia_full["Method_Used"] = "Reference"
transformed_records.append(arcadia_full)
for st in other_stations:
st_data = obs_df[(obs_df["StationID"] == st) & (obs_df["Parameter"] == "TN")].copy() # ENFORCE strictly TN
st_data["Normalized_Value"] = np.nan
st_data["Method_Used"] = "Baseline"
for param in ["TN"]:
method_info = station_models.get((st, param))
mask = st_data["Parameter"] == param
if method_info is None or len(st_data[mask]) == 0:
st_data.loc[mask, "Normalized_Value"] = st_data.loc[mask, "Result_Value"]
st_data.loc[mask, "Method_Used"] = "None_Found"
continue
m_name = method_info["method"]
m_obj = method_info["model"]
orig_vals = st_data.loc[mask, "Result_Value"].values
if m_name == "LR":
norm_vals = m_obj.predict(orig_vals.reshape(-1, 1))
else:
norm_vals = orig_vals
norm_vals = np.clip(norm_vals, a_min=0.01, a_max=st_data.loc[mask, "Result_Value"].max() * 1.5)
st_data.loc[mask, "Normalized_Value"] = norm_vals
st_data.loc[mask, "Method_Used"] = m_name
transformed_records.append(st_data)
final_reanalysis_df = pd.concat(transformed_records, ignore_index=True)
# Important: groupby resets indices if applying multiple columns without re-assigning proper indices
def prioritize_station_values(group):
if len(group) == 0:
return None
arc_obs = group[group["StationID"] == arcadia_id]
if len(arc_obs) > 0:
return arc_obs.iloc[0]
mean_val = group["Normalized_Value"].mean()
rep_row = group.iloc[0].copy()
rep_row["StationID"] = "Merged_Average"
rep_row["Normalized_Value"] = mean_val
rep_row["Method_Used"] = "Averaged_Transform"
return rep_row
unified_timeline = final_reanalysis_df.groupby(["SampleDate", "Parameter"], as_index=False).apply(prioritize_station_values).reset_index(drop=True)
print("Unified Multi-Station Dataset Assembled!")
print(f"Total Date-Parameter Unique Records: {len(unified_timeline)}")
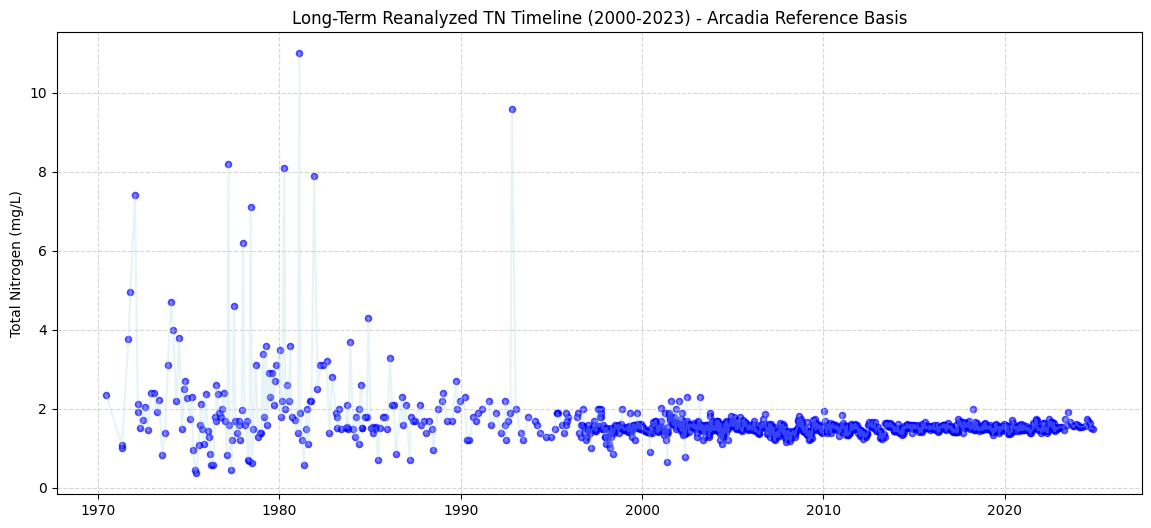
import matplotlib.dates as mdates
fig, ax = plt.subplots(figsize=(14, 6))
tn_timeline = unified_timeline[unified_timeline["Parameter"] == "TN"].sort_values("SampleDate")
ax.scatter(tn_timeline["SampleDate"], tn_timeline["Normalized_Value"], alpha=0.6, color='blue', s=20)
ax.plot(tn_timeline["SampleDate"], tn_timeline["Normalized_Value"], color='lightblue', alpha=0.3)
ax.set_title("Long-Term Reanalyzed TN Timeline (2000-2023) - Arcadia Reference Basis")
ax.set_ylabel("Total Nitrogen (mg/L)")
ax.xaxis.set_major_formatter(mdates.DateFormatter('%Y'))
plt.grid(True, linestyle="--", alpha=0.5)
plt.show()
Unified Multi-Station Dataset Assembled!
Total Date-Parameter Unique Records: 1097
# Quick Validation check: Why was standardization needed?
# Comparing Reference to Non-normalized values across overlapping stations
from sklearn.metrics import mean_squared_error, mean_absolute_error

print("--- Comparison of Overlapping Records: Raw vs Optimized Normalized ---")
for st in other_stations:
    st_data = obs_df[obs_df["StationID"] == st].set_index(["SampleDate", "Parameter"])["Result_Value"].unstack().resample('ME').mean()
    arc_data_monthly = obs_df[obs_df["StationID"] == arcadia_id].set_index(["SampleDate", "Parameter"])["Result_Value"].unstack().resample('ME').mean()

    paired = pd.merge(arc_data_monthly, st_data, left_index=True, right_index=True, suffixes=('_arc', '_st'))

    for param in ["TN"]:
        if f"{param}_arc" not in paired.columns or f"{param}_st" not in paired.columns:
            continue

        param_pair = paired[[f"{param}_arc", f"{param}_st"]].dropna()
        if len(param_pair) < 5: continue

        y_true = param_pair[f"{param}_arc"]
        y_raw = param_pair[f"{param}_st"]

        m_info = station_models.get((st, param))
        if m_info is None: continue

        m_name = m_info["method"]
        m_obj = m_info["model"]

        if m_name == "LR":
            y_norm = m_obj.predict(y_raw.values.reshape(-1, 1))
        else:
            y_norm = y_raw.values

        raw_rmse = np.sqrt(mean_squared_error(y_true, y_raw))
        norm_rmse = np.sqrt(mean_squared_error(y_true, y_norm))

        print(f"Station {st} {param} | Raw RMSE: {raw_rmse:.3f} -> Optimized ({m_name}) RMSE: {norm_rmse:.3f}")
--- Comparison of Overlapping Records: Raw vs Optimized Normalized ---
Station 2297330 TN | Raw RMSE: 1.584 -> Optimized (LR) RMSE: 0.363
Station 270318081593100 TN | Raw RMSE: 1.021 -> Optimized (LR) RMSE: 0.308
Station 3556 TN | Raw RMSE: 0.566 -> Optimized (LR) RMSE: 0.358
Station PR14 TN | Raw RMSE: 0.631 -> Optimized (LR) RMSE: 0.322
Station PR18 TN | Raw RMSE: 0.474 -> Optimized (LR) RMSE: 0.317
# Filter the final timeline to only include dates from 2000 to 2023
unified_timeline_filtered = unified_timeline[
    (unified_timeline["SampleDate"] >= "2000-01-01") &
    (unified_timeline["SampleDate"] <= "2023-12-31")
]

# Export
unified_timeline_filtered.to_csv("Arcadia_Unified_TN_Reanalysis_2000_2023.csv", index=False)
unified_timeline_filtered.head()
| SampleDate | Parameter | StationID | Result_Value | Normalized_Value | Method_Used | |
|---|---|---|---|---|---|---|
| 300 | 2000-01-05 | TN | Merged_Average | 1.56 | 1.561020 | Averaged_Transform |
| 301 | 2000-01-18 | TN | Merged_Average | 1.30 | 1.469676 | Averaged_Transform |
| 302 | 2000-02-09 | TN | Merged_Average | 1.34 | 1.510105 | Averaged_Transform |
| 303 | 2000-02-15 | TN | Merged_Average | 1.10 | 1.466465 | Averaged_Transform |
| 304 | 2000-03-08 | TN | Merged_Average | 1.09 | 1.452246 | Averaged_Transform |
# 6. Validation using Nearest-Neighbor Matching (±15 days)
print("--- Validation Results: Nearest-Neighbor (±15 days) vs Monthly Averaged ---")

# We need the raw unaggregated data for Arcadia
arc_raw = obs_df[obs_df["StationID"] == arcadia_id].sort_values("SampleDate")

nn_validation_results = []

for st in other_stations:
    st_raw = obs_df[obs_df["StationID"] == st].sort_values("SampleDate")

    for param in ["TN"]:
        # Filter by parameter
        arc_p = arc_raw[arc_raw["Parameter"] == param].dropna(subset=["Result_Value"])
        st_p = st_raw[st_raw["Parameter"] == param].dropna(subset=["Result_Value"])

        if len(arc_p) == 0 or len(st_p) == 0:
            continue

        # Perform merge_asof to find closest Arcadia record within ±15 days
        paired_nn = pd.merge_asof(
            st_p,
            arc_p,
            on="SampleDate",
            direction="nearest",
            tolerance=pd.Timedelta(days=15),
            suffixes=('_st', '_arc')
        ).dropna(subset=["Result_Value_arc"])

        if len(paired_nn) < 5:
            continue

        y_true = paired_nn["Result_Value_arc"].values
        y_raw = paired_nn["Result_Value_st"].values

        m_info = station_models.get((st, param))
        if m_info is None:
            continue

        m_name = m_info["method"]
        m_obj = m_info["model"]

        if m_name == "LR":
            y_norm = m_obj.predict(y_raw.reshape(-1, 1))
        else:
            y_norm = y_raw

        raw_rmse_nn = np.sqrt(mean_squared_error(y_true, y_raw))
        norm_rmse_nn = np.sqrt(mean_squared_error(y_true, y_norm))

        # Get the monthly RMSE from previously calculated validation_results if available
        monthly_norm_rmse = None
        for res in validation_results:
            if res["Station"] == st and res["Parameter"] == param:
                monthly_norm_rmse = res[f"RMSE_{m_name}"]
                break

        monthly_str = f"{monthly_norm_rmse:.3f}" if monthly_norm_rmse is not None else "N/A"

        nn_validation_results.append({
            "Station": st, "Parameter": param, "N_Pairs (±15d)": len(paired_nn),
            "Method": m_name,
            "NN_Raw_RMSE": raw_rmse_nn,
            "NN_Norm_RMSE": norm_rmse_nn,
            "Monthly_Norm_RMSE": monthly_norm_rmse
        })

        print(f"Station {st} {param} | Pairs: {len(paired_nn)} | Method: {m_name} | "
              f"NN Raw RMSE: {raw_rmse_nn:.3f} -> NN Norm RMSE: {norm_rmse_nn:.3f} "
              f"(vs Monthly: {monthly_str})")

nn_val_df = pd.DataFrame(nn_validation_results)
display(nn_val_df)
--- Validation Results: Nearest-Neighbor (±15 days) vs Monthly Averaged ---
Station 2297330 TN | Pairs: 40 | Method: LR | NN Raw RMSE: 1.419 -> NN Norm RMSE: 0.431 (vs Monthly: 0.336)
Station 270318081593100 TN | Pairs: 33 | Method: LR | NN Raw RMSE: 1.007 -> NN Norm RMSE: 0.319 (vs Monthly: 0.393)
Station 3556 TN | Pairs: 38 | Method: LR | NN Raw RMSE: 0.506 -> NN Norm RMSE: 0.390 (vs Monthly: 0.410)
Station PR14 TN | Pairs: 65 | Method: LR | NN Raw RMSE: 0.575 -> NN Norm RMSE: 0.320 (vs Monthly: 0.348)
Station PR18 TN | Pairs: 91 | Method: LR | NN Raw RMSE: 0.417 -> NN Norm RMSE: 0.305 (vs Monthly: 0.391)
| Station | Parameter | N_Pairs (±15d) | Method | NN_Raw_RMSE | NN_Norm_RMSE | Monthly_Norm_RMSE | |
|---|---|---|---|---|---|---|---|
| 0 | 2297330 | TN | 40 | LR | 1.419178 | 0.431397 | 0.335531 |
| 1 | 270318081593100 | TN | 33 | LR | 1.006676 | 0.319298 | 0.393302 |
| 2 | 3556 | TN | 38 | LR | 0.505658 | 0.389903 | 0.409611 |
| 3 | PR14 | TN | 65 | LR | 0.575263 | 0.319801 | 0.347609 |
| 4 | PR18 | TN | 91 | LR | 0.417134 | 0.304542 | 0.390657 |
import matplotlib.pyplot as plt
import pandas as pd
# Load the exported CSV
plot_df = pd.read_csv("Arcadia_Unified_TN_Reanalysis_2000_2023.csv")
plot_df["SampleDate"] = pd.to_datetime(plot_df["SampleDate"])
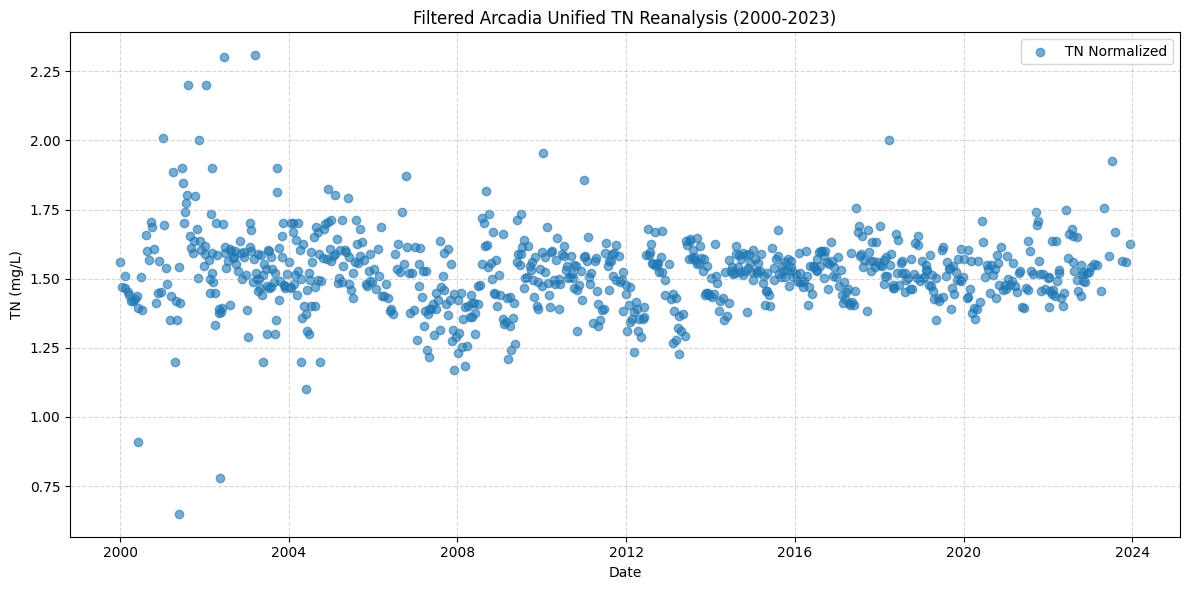
plt.figure(figsize=(12, 6))
plt.scatter(plot_df["SampleDate"], plot_df["Normalized_Value"], marker='o', alpha=0.6, label="TN Normalized")
plt.title("Filtered Arcadia Unified TN Reanalysis (2000-2023)")
plt.xlabel("Date")
plt.ylabel("TN (mg/L)")
plt.grid(True, linestyle="--", alpha=0.5)
plt.legend()
plt.tight_layout()
plt.show()
import matplotlib.pyplot as plt
import pandas as pd
# Load the exported CSV
merged_df = pd.read_csv("Arcadia_Unified_TN_Reanalysis_2000_2023.csv")
merged_df["SampleDate"] = pd.to_datetime(merged_df["SampleDate"])
plt.figure(figsize=(14, 7))
# Plot original observation data by station
# (obs_df should still be in memory from previous cells)
for st in obs_df["StationID"].unique():
st_data = obs_df[(obs_df["StationID"] == st) & (obs_df["Parameter"] == "TN")].copy()
# Cap original observations to the 2000-2023 interval
st_data = st_data[(st_data["SampleDate"] >= "2000-01-01") & (st_data["SampleDate"] <= "2023-12-31")]
if len(st_data) > 0:
plt.scatter(st_data["SampleDate"], st_data["Result_Value"], alpha=0.5, label=f"Station {st} (Raw)", s=20)
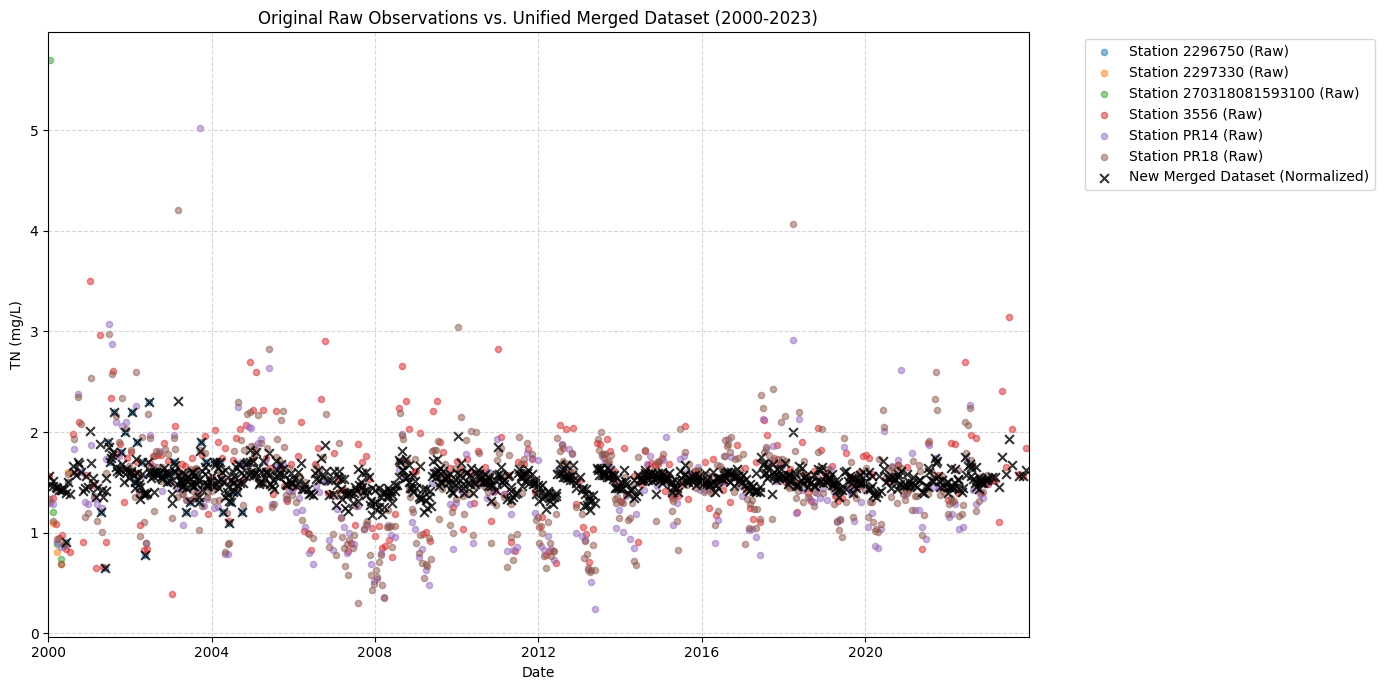
# Plot the new merged dataset in black
plt.scatter(merged_df["SampleDate"], merged_df["Normalized_Value"],
color='black', marker='x', alpha=0.8, label="New Merged Dataset (Normalized)", s=40)
plt.title("Original Raw Observations vs. Unified Merged Dataset (2000-2023)")
plt.xlabel("Date")
plt.ylabel("TN (mg/L)")
plt.grid(True, linestyle="--", alpha=0.5)
plt.legend(bbox_to_anchor=(1.05, 1), loc='upper left')
plt.xlim(pd.Timestamp("2000-01-01"), pd.Timestamp("2023-12-31"))
plt.tight_layout()
plt.show()